
This week, it was announced that the majority of the UK is pushing towards reopening much of the hospitality and cosmetics industries following the COVID19 pandemic; and thats the kicker, COVID19 is still here! Thankfully, while the spectre of Coronavirus is here, we have the latest estimated R numbers for EVERY UK region!
Keep reading to find out the R number in your region!

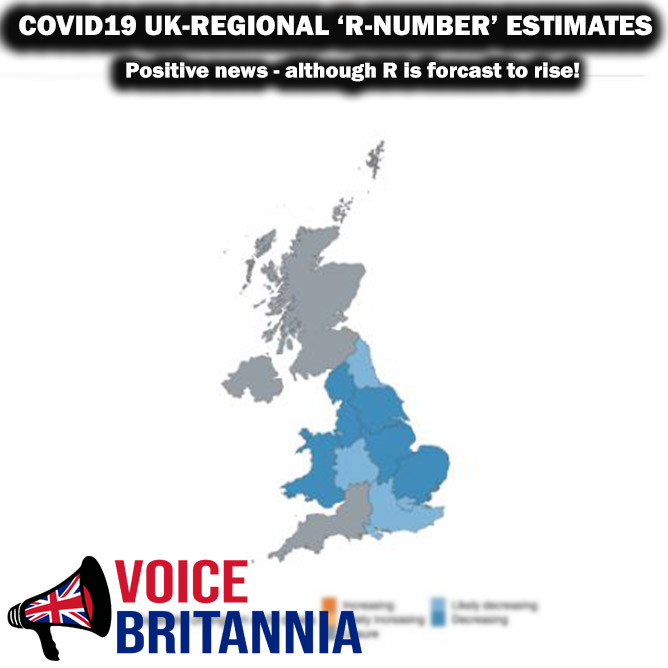
Overall, the latest estimates by the CMMID Covid working group show a more positive outlook that we have became used to. When looking at the ‘expected daily confirmed cases by region’, we see decreases in all areas other than the South-West of England. (Scotland and Northern Ireland are not included on this chart).

Currently, East Midlands, London, North West, South East, West Midlands and Yorkshire are reported to have the most confirmed cases of Coronavirus.
When looking the R numbers over time, we can see that while they are all close to or around an R of 1.0; The forecasts for all these areas indicate a potential rise in R within these 6 areas. Of the 6 forecasts, London appears to have the highest potential rise with the forecast stating that by today, R in London could be as high as 1.2/1.3.

The overall R-number estimates also show a more promising outlook going into the second weekend of freedom for many people; however, things really have not improved that much from last week. Of the 12 UK regions, 7 are sitting at or above an r number of 0.9, with Northern Ireland still at the top of the list with an R of 1.3, although that could also be as low as 0.4, or as high as 2.2!
With the majority of the UK sitting with an R number that is under 1.0, politicians (who have doners that own pubs to keep happy), and some business owners are seeing this as the COVID19 checkered flag and time to get earning again; Although the data from CMMID does not show the UK entering the end game, we are far from that.
While the recent estimates DO show R as at or below 1 across most of the UK, the data also shows there is the possibility that R may be at or above 1 in most areas.
Conclusion

overall, on a national level, the recent estimates from CMMID show the effective reproduction number (R) as sitting at 0.8, which is a drop from previous weeks.
This week’s estimates show a much better picture nationwide than previous weeks; However, it should be remembered that CMMID has forecasted a rise in R in the ‘6 most affected areas’ in England; which, if true, would indicate R as already being above 1.0 in London, North West, South East, West Midlands and Yorkshire!
Stay safe, Wear a mask, wash your hands and keep your distance!
What do you think of the COVID19 estimates? Do these stats help you decide what you will be doing, or do you just do what you want anyway?
Follow us on Facebook and Twitter and tell us what you think!